
 Almost exactly two years ago, Alexis Kreager and I published a big report into the gender inequality faced by film directors working in the UK film industry.
Soon after it was published, we were approached by the Writers’ Guild of Great Britain (WGGB) about studying the plight of screenwriters, both in the film and television industries. This led to the WGGB (along with the Authors’ Licensing and Collecting Society – ALCS) supporting us in carrying out a deep data dive into the experiences of UK writers.
The full 177-page report can be downloaded here, and I have written a brief summary in the article below.
You can read more about the Writers’ Guild and ALCS’ campaign connected to the report at writersguild.org.uk/equalitywrites
The report covers both the film and TV industries. In this blog summary, I’ll cover film first before turning to TV and finally looking at career progression among writers.
WE RECOMMEND THE VIDEO: 2021 Sony Charishta New Telugu Hindi Dubbed Blockbuster Movie | South Hindi Movies Top Ranker | PV
2021 Sony Charishta New Telugu Hindi Dubbed Blockbuster Movie | South Hindi Movies Top Ranker | PV Please Subscribe Housefull Cinema ...
Female screenwriters of UK feature films
Over the twelve years we studied, women accounted for just 16% of screenwriters of UK feature films.
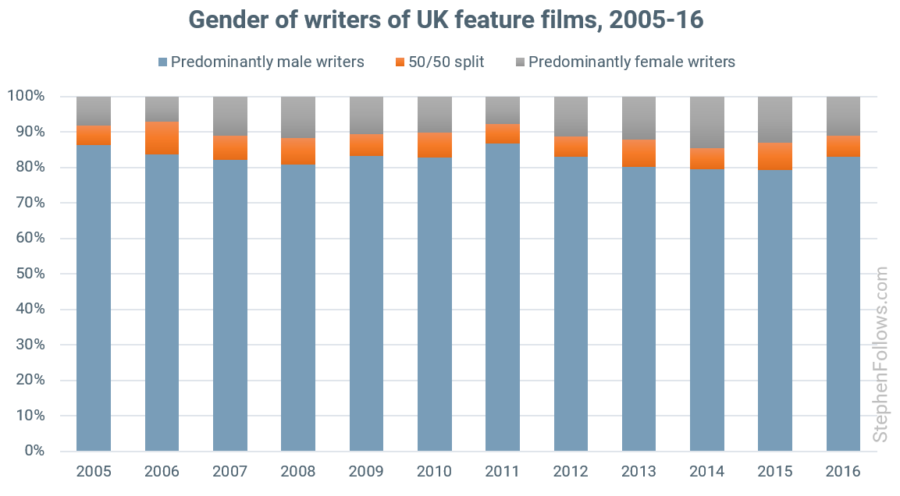
One way to think about it is to consider how many films have a majority female writing team (including those written exclusively by women). Between 2005 and 2016, four out of every five UK movies were written mainly by male writers.
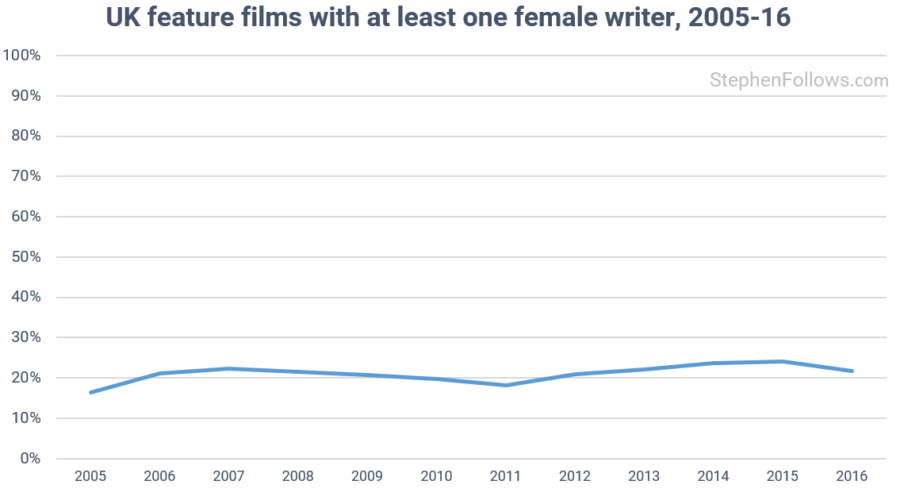
If we broaden the question to ask ‘how many UK films had even one female writer?’ then we’re still looking at under a quarter of all films made.
Public funding for female-written films
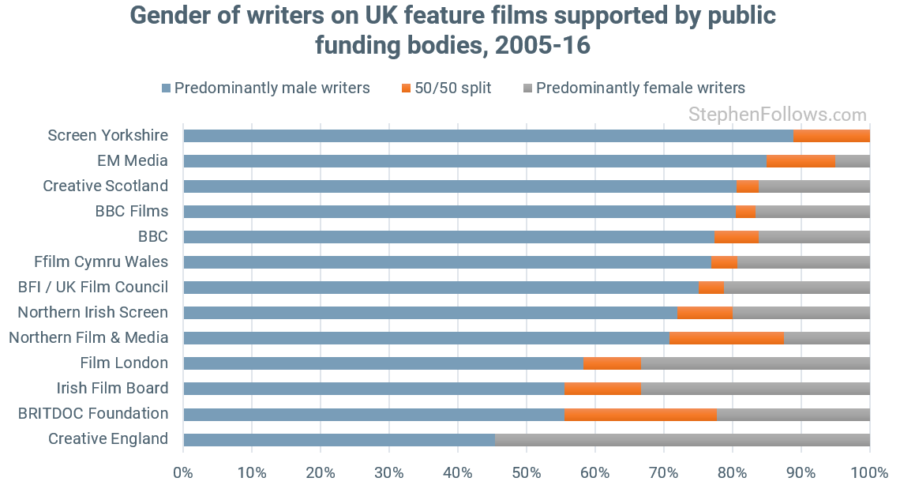
Around a fifth of all UK films have received some form of public funding support. This could be as little as a few thousand pounds at the development stage right up to full production funding covering the entire budget. Of the UK public funders, Creative England and BRITDOC (now called the Doc Society) and Film London are the most supportive of female-written feature films.
Female writers of UK television programmes
This blog focuses on the film industry, but the report looked equally at the film and television industries. If TV’s your thing, then I suggest you download the full report because, for brevity’s sake, I’m only going to include the headline TV stats here.
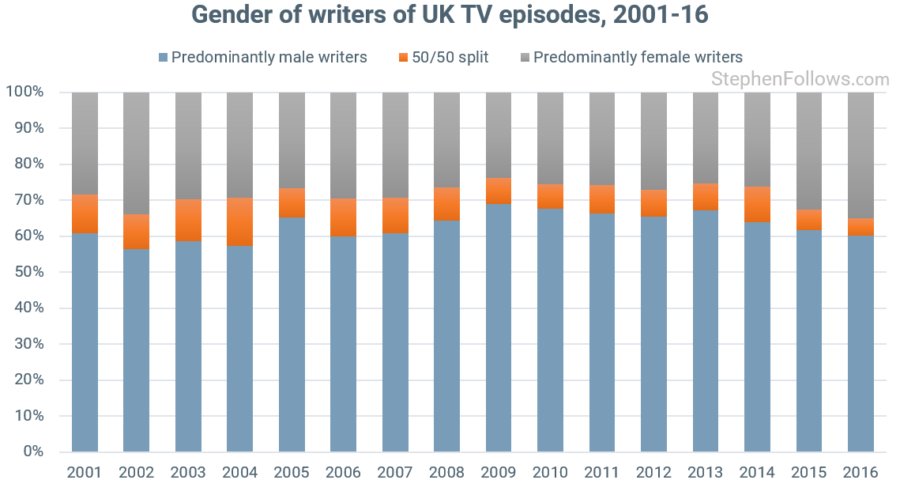
The picture for female writers of TV programmes is slightly better than that of feature film screenwriters but it is still rather grim. Between 2001 and 2016, only 30% of UK TV writers were female.
The journey to being a top writer
The report goes into a lot of detail about the path most writers take to the top of their profession, such as writing major movies and/or prime time TV, but I wanted to give a flavour of the findings here, too.
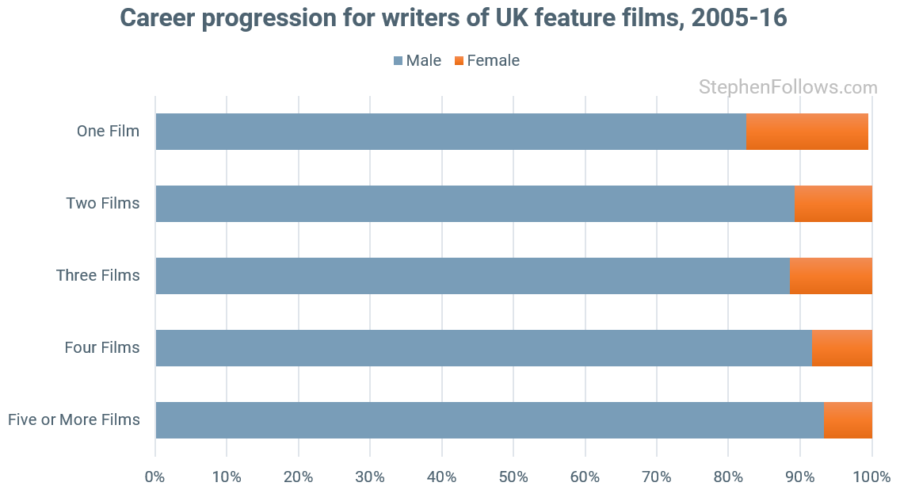
In film, women make up a smaller and smaller percentage of writers as you move up the experience spectrum. Of writers who had written one film in our dataset, 17% were women. Compare this with just 7% of writers who had written five or more films in our dataset and it’s clear that not only are women finding it hard to get in, they are also struggling to stay in the industry.
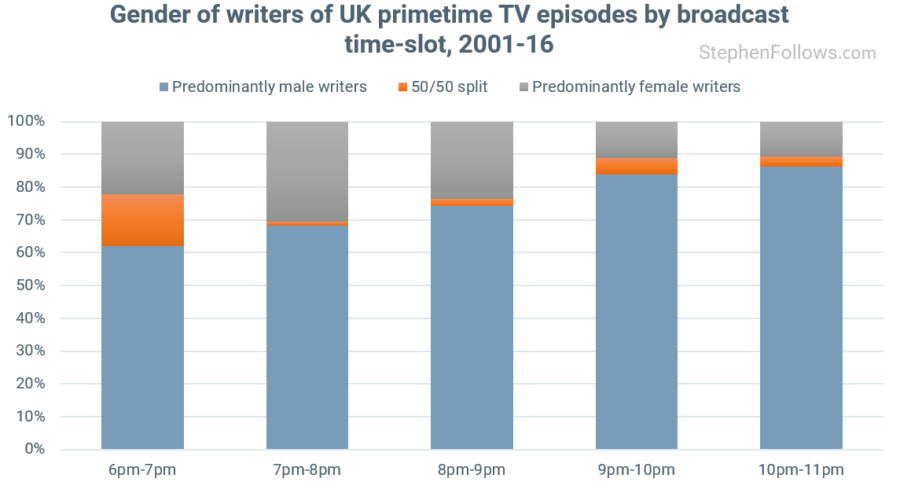
The picture is similar in TV. Male writers dominate at prime time, and their dominance increases as the spots become more prestigious (and valuable to advertisers). 62% of UK TV episodes shown at 6pm are written predominantly by men, compared with 86% of shows airing at 9pm.
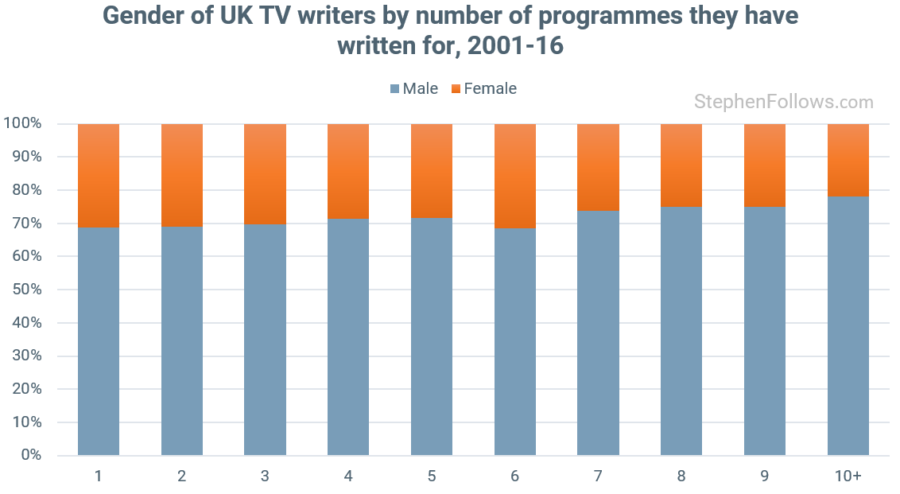
As well as finding it harder to write for prime time shows, female writers are also having a harder time working on a broad selection of shows, compared to male writers. Of those who have only written for one show, 31% were women, compared with 22% of those who had written for ten or more shows.
The journey women take to the upper echelons of screenwriting can be simplified into one chart. At each major stage of career progression, we see women accounting for an ever smaller percentage of writers.
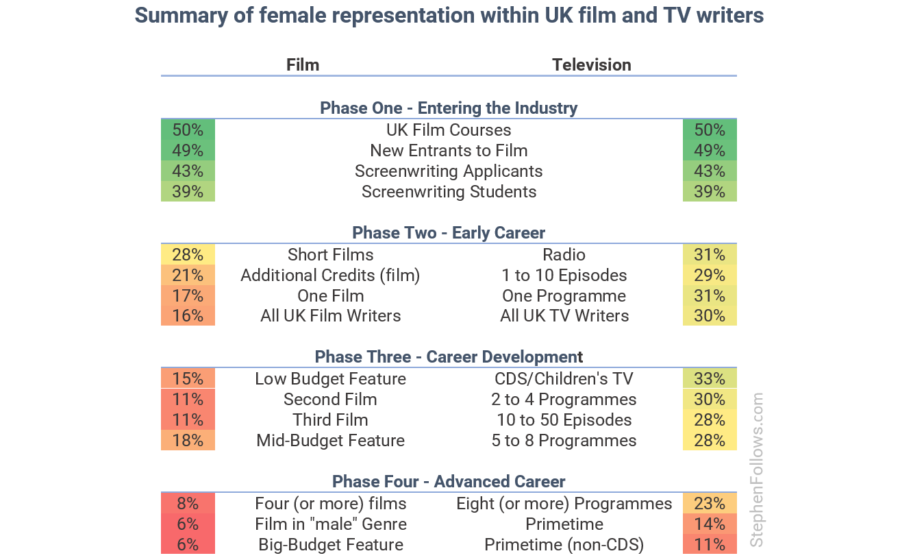
N.B. “CDS” refers to continuing drama series, such as EastEnders, Casualty, Hollyoaks, Emmerdale, Coronation Street, Holby City, Doctors, etc.
An interesting note to end on
Reports like this are never fun to read (or to research and write, for that matter!) And so, in an effort not to end on such a bleak note, I wanted to share a minor finding from the research process.
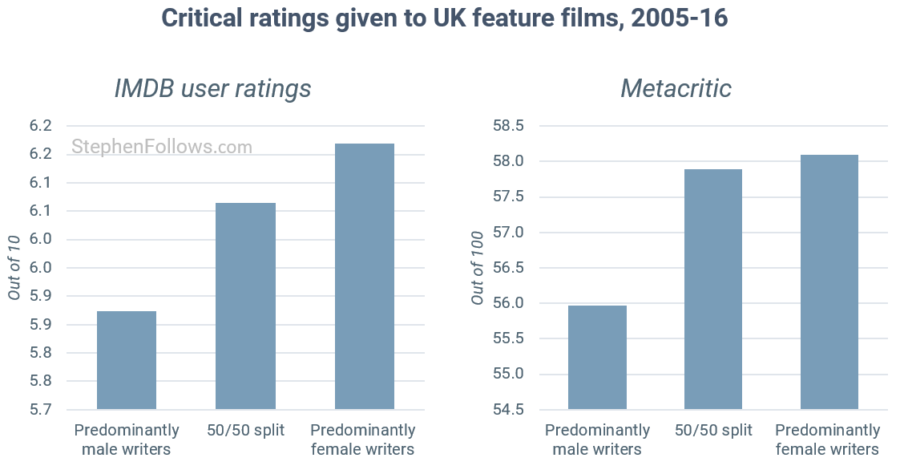
We were looking at what evidence there was to explain the gender imbalance beyond just an industry-wide unconscious bias (i.e. are female writers unable or unwilling to do what male writers are?) Unsurprisingly, we did not find any evidence that female writers are any less able, talented or hardworking than their male counterparts. In fact, we found that both critics and audiences judge films from female writers as slightly better than those written by men.
Notes
The report contains detailed explanations of our data, methodology and important clarifications and caveats. If you would like to use the findings in this article then I suggest having a read of the notes in the full report to ensure you’re getting the complete picture.
My co-author Alexis Kreager took the lead with the project and it’s fair to say that without him it would not have happened. I’m grateful to him for his dedication, focus and hard work.
I’m also grateful to the Writers’ Guild of Great Britain (WGGB) and Authors’ Licensing and Collecting Society (ACLS) for supporting the report, both in resources and data. You can read about their campaign which follows this report at www.writersguild.org.uk/equalitywrites.
Epilogue
This is the second major report I’ve co-authored into gender inequality in the UK film industry. On the one hand, it is rather depressing to get deep into the topic and see how unequal our industry remains. On the other, it’s inspiring to meet so many people along the way who are determined that change is possible and are willing to play their part.
32 Comments
l Patrick
May 24, 2018 @ 7:27 am
I believe in equality and a job should go to whom ever is best for the position regardless of race, sex, color or religion. The trouble here is, which no one seems to mention is that if there’s 100 applicants and 80 of them are white males, 15 are females and the other 5 are minorities, then odds are the job would go to a white male, not because of their sex or color, but because there’s more of them in that field and or applying for the position.
I would like to see more women and other ethnic minorities as writers, directors, but I don’t think a person should have the privilege of getting the job just because of their sex or race, it should always be about whom is best for the position.
There are more female nurses working than there are males. Shall we just not hire female nurses and hire male ones only, give the male nurses a right of way over the females, regardless that there’s more females applying for the jobs or they are better suited for the position?
A job should go to whoever is better for the role, if the man or the woman is best for the role, they should get the job for this reason and not because of anything else. There should be no discrimination against anybody, but it seems to me there is discrimination against white British males now, maybe there was a point in time when that was an advantage for some, but not for me, we are all individuals, I am an individual and the trouble with the world, people like to separate races, colors, religions, sexes, when we should all be treated as equals, nothing less, nothing more, just fairness.
Hi Patrick. I completely agree that this conversation should be about fairness and equality of opportunity. If more men than women want to be screenwriters then I don’t think that we should strive for exact parity in numbers.
The key thing to understand is that current playing field is not even. Women have a harder time than men at almost every stage, due to a pervasive unconscious bias. We need to work to counter this bias, and then let the chips lie where they may. If all candidates have the same equal chances, no matter their gender, race, class, etc, then we can leave the sector to pick the best person for each role. But while the deck is stacked against some groups, we should work to find ways of countering this negative effect.
Sam
June 1, 2018 @ 6:41 am
i think you nailed it with your comment “I don’t think that we should strive for exact parity in numbers”. You then go on to mention ‘pervasive unconscious bias’; what evidence did you find of this in your study and how significant was this bias in terms of being the key driver of the disparity in representation of women in the industry?
Hey Sam. Sorry for the delayed response; it missed it and have only just noticed I didn’t answer.
The short answer is that we can’t know for sure, but it’s by far and away the most likely answer.
The long answer is:
Part of the reason we structure our report into clear sections is that we want to split data from opinion.
1. The first section says “What is the industry like?”. These are data points, hopefully with no bias or spin. Selection bias could be a factor (i.e. what we chose to put in or leave out) but we were conscious of this and aimed to avoid it. As a backstop, it should be easy to spot if I’m wrong. For example, we didn’t track the BBC Writers Room and someone above has asked about that, so I’m following that thread now. This means that this section is just data. In the writer’s report, this is part one and two because it looked at both film and TV, whereas on the directors’ report it was just film.
2. The next part asks “How do writers get to be writers?”. This is based on data, although less clear and harder for anyone else to verify. It’s interviews, surveys and external data points which are relevant. This again is aiming to be fact-based, not opinion.
3. The last part aims to ask “Why is this happening?” and “What should we do about it?”. This is our professional opinion, based on the sections above. Hopefully, the previous sections arm everybody up enough to have an intelligent debate, including disagreeing with our conclusions. Have we read the data wrong? Have we jumped to conclusions? Have we ignored certain key factors? etc.
In the third section of this report, we have concluded that unconscious bias is the main factor at play for a number of reasons:
1. The data clearly shows that women do not start out less keen to be writers. The earliest stages of the career journey are largely 50:50 and we found no evidence anywhere of a growing disinterest in progressing to the higher levels of the industry when comparing women and men.
2. If the lack of women at the highest level were due to societal factors (i.e. having children) then we would expect to see 50:50 until a certain age, a precipitous decline and then a consistent low base. Instead, we see a gradual decline, happening in parallel with how big and/or risky the industry regards a project to be. This suggests to us that the effect is more to do with the industry and the project than the writer and their life choices.
3. If it were due to a wider trend (put plainly, the world is generally becoming less sexist) then we would expect to see faster gains for women. In fact, the state of female representation has not increased in line with general attitudes. The systemic issues we highlight in the report suggest that a number of factors have allowed the industries to continue unfair practices almost without restraint.
4. Female writers are demonstrably no less talented than their counterparts, meaning that this effect is not down to pragmatic business decisions.
5. Given the way the industries are structured, the types of behaviours which are rewarded and how decisions are made, an unconscious bias towards women seems the most likely explanation for the effects highlighted earlier in the report.
6. Unconscious bias has been shown to be prevalent in many other fields, including those where it can be tested more plainly, such as orchestra auditions.
Everyone is free to come to their own conclusions. Maybe some people think we have underappreciated personal choice, or the effect of having baby, or something else. That’s fine and we should encourage debate. I would rather our work is scrutinised and challenged than just accepted blindly.
After years of research on the topic, my professional opinion is that no other explanation of the facts more pervasive than the notion of unconscious bias.
Hope that helps. There’s more on each of these points in the report (pages 107 to 127).
I read the above and I even read the full report.
Then I thought to myself “When did I last read a script by a woman?” It had been a while! I then looked at some list on the Interweb of what someone thought were the 100 best movies ever made and found just two written by women (ET and Thelma and Louise). Obviously women writers are just not getting a fair shake – I thought to myself!
“So what about all these scripts that are being pitched by women and are just being ‘file-13’ed’?” I thought.
I went through 20 scripts that we have recently had to politely turn down (or just ignored!) I waded through some truly turgid, wordy nonsense, each and every one a complete ‘dog’, reading tag line after tag line, each more dreadful than the next and looked at the name to see what gender the author was. Just one was a joint M+F effort and one was from a woman.
That suggests to me that women are not writing scripts – it is after all a dreadfully speculative activity and judging by those twenty ‘dogs’, an activity mainly engaged in by the deluded, as absolutely non of the tag lines drew one in, or made one curious as to what happens next. “So what?” was my usual reaction to what I read.
OK, so 20 bad scripts do not form much of a sample, but everywhere I look, it is men that are pitching the ideas, albeit often pretty ghastly ideas.
If this small straw poll reflects the wider script market and women are not writing many scripts, good or bad, we must ask ourselves the question why!
Thanks for sharing your experience, and for reading the full research. I’m always keen to engage with people who have ideas based on the research (or their own research).
In Sweden, the SFI conducted a similar exercise to you, in that they went back over previously rejected projects and discovered some female-led gems they had overlooked.
It’s certainly true that the vast, vast majority of scripts written are not good. They vary in their shortcomings but even Hollywood studios paying professional readers to consider projects result in a very high rejection rate.
We also found that some pockets of the industry treat women more fairly than others. We’re not saying that everyone is doing it wrong, just that the big picture when taken together is bad.
So it could be any number of factors which led to you having that experience. You theory could be right, the sample size could be too small, maybe you are better attuned to ignoring gender bias than others, etc.
But when you zoom out and look at the industry in aggregate, it’s looks to us that women do not have the same treatment as men overall.
Peter
June 11, 2018 @ 8:42 am
Did you approach the BBC Writersroom for gender breakdown of applicants and winners, year on year? As this is such a big profile industry entry point, I would have thought it would have been useful to see if women are passed over vs no. of applicants. Can’t seem to see any specific mention of it in your report (unless it is categorised under “other”?). Is this data you would be willing to share?
We didn’t approach them separately. as those people would have been included in the Project Diamond stats.
There were a few other entry points we wanted to study in detail (such as competitions, other schemes, etc) but were hampered by two things – resources and data availability. The report took over a year and ended up being almost 200 pages – we had to draw the link somewhere as otherwise we would have kept studying every possible route! Secondly, some bodies were not willing to share their data. In some cases, we could use industry pressure or the Freedom of Information Act to get past this but in others we drew a blank. In theory, all BBC employment is covered by Project Diamond but in practice we found this wanting for a few reasons (as detailed in the report).
In my ideal world, this kind of research would not be organised into a report but rather as an on-going monitoring site. We should be tracking these stats every month / quarter / year and sharing the results. This would allow the promotion of best practice and public discussion of who’s doing what. Again, this comes down to resources as the Writers Guild were able to support a report, but I’ve not yet found a funder for an on-going project.
Peter
June 12, 2018 @ 8:30 am
Indeed? I had thought that Diamond related to Broadcast rather than writer development.
Of course it is axiomatic that you would study engagement levels on University courses, etc, but as you note on pg 111 only a minority of people enter TV and Film this way, so I am surprised you give this the prominence you do, eg on pg 94 and other places.
Studying competitions would indeed have required significant work, but BBC Writersroom at the least, could have been a useful bellwether, because it is the UK’s flagship competition and, being free, does not prevent people applying on the basis of cost. I would have thought that most UK screenwriters would have entered it at some stage.
A very fair point. I will look into it and report back.
My gut feeling is that it’s less significant than you suggest, but let’s have a look at the data and see what the reality is. No need for us to rely on our guts when numbers should provide answers!
Peter
June 12, 2018 @ 8:43 am
Agreed and many thanks for your speedy reply.
No dice. They refused, citing artistic grounds. In their words…
The information you have requested is excluded from the Act because it is held for the purposes of ‘journalism, art or literature.’ The BBC is therefore not obliged to provide this information to you. Part VI of Schedule 1 to FOIA provides that information held by the BBC and the other public service broadcasters is only covered by the Act if it is held for ‘purposes other than those of journalism, art or literature”. The BBC is not required to supply information held for the purposes of creating the BBC’s output or information that supports and is closely associated with these creative activities.
I don’t think we’ve ever been successful in a BBC FOI request as they use this reason often.
Peter
July 2, 2018 @ 9:41 am
Thanks for trying. I didn’t think they would invoke any Act, seems a bit OTT to me. I was just curious because of this blog: http://www.bbc.co.uk/blogs/writersroom/entries/f31ff216-f67f-4f85-a98c-cc5615032ba2 – blogger seems to put gender balance at 75%/25% in men’s favour, but of course, it’s just the comedy intake in one year, impossible to say if it is representative of the BBC Writersoom as a whole, let alone industry entry points. (Posting this in the right Reply this time)
I Patrick
June 14, 2018 @ 4:41 pm
Hi Stephen,
yes I totally agree with you. I just want everyone to be treated as equals, we should not look at each other as different species because of our color, sex, race, religion etc we are all individuals and all equals and if there’s 100 people who can do the job better than me, then I’m happy for that regardless of anything else 😉
Anyway, keep up the good work that you do,
best, Pat
Peter
June 19, 2018 @ 9:22 am
Hi Stephen, you provide a year on year graph of TV Writing Teams, male vs female dominated (pg 50 – 2.1b “Representation over Time”)
However, with regards to the no. of individual male vs individual female TV writers, you give a top-line figure of 30% (pg 48 – 2.1a “Gender of UK Television Writers”) for 2001-2016, but no year on year progression as you do for teams on pg 50, unless I’m missing something.
Is this something you would be willing to share?
The chart on page 50 isn’t just teams, it’s also shows written entirely by women. So does that mean it’s what you’re after? Let me know if I’ve misunderstood.
Peter
June 20, 2018 @ 3:52 pm
I am looking for a raw figure of no of female writers vs no of male writers in TV, whether they were part of a team or not. I assume that is what the 30% on pg 48 relates to, but I would love to see how that balance has changed year on year. Hope that clarifies.
Ah gottcha. That makes sense and is a reasonable request. However, in this rare case, I can’t share data. I know it’s the whole point of this site but hear me out…
The raw data came from ACLS and is based on the tracking they do of TV programs. We didn’t say we would release raw numbers and so I’m not 100% sure where I stand on doing so. For most datasets I deal with I have personally collected the raw data and so am very clear on what’s shareable.
But there is a second issue. Their data doesn’t make promises of being comprehensive in every way. Obviously, they’re doing everything they can to track all the programs but the scale of the challenge means that there could be variance in their data collecting between years. In percentage terms, this is not a major problem as there no reason to think any data collection errors would be gender biased in either direction. But if we were to study the raw numbers of writers then it could be ‘finding’ false trends. I’ve just looked at the raw data and I suspect that could happen.
In order to feel confident enough to publish them, I would need to go back to ACLS and dig deep into how their methodologies and criteria changed over the years. We obviously did much of this a year or so ago when we started the gender report and were satisfied with the validity of the data when it comes to percentages, but I can’t remember enough offhand how that relates to the raw data.
So the short story is: I’m not sure I’m allowed to and I would have to do more work than I can right now to explain what they show.
Sorry, Peter. My aim is as much data transparency as possible but sometimes I have to weigh that up with permission and accuracy.
Peter
June 21, 2018 @ 2:37 pm
I see – I thought that as you had already used ACLS data on the episodes that were male or female dominated, then you would be able to show no. of male vs no. of female writers year on year from the same data.
So the metric on pg 50 faces a potential challenge, in that, for argument’s sake, it could have been that there were 0 male dominated episodes, however, every episode was female dominated by only 1%, giving a nearly 50:50 TV industry split overall. I realise it’s not true or likely, I simply use that to illustrate my point. But it could be that the number or female vs male writers overall paints a very different picture to the Pg 50 graph, in favour of either men or women, particularly in terms of year on year trends and so would help us understand the overall 30% figure you cite on pg 48 better.
Yes and no. Your point is correct in that the data not being complete in all cases does open it up to possibility of extreme cases showing incorrect percentages.
But in this case the numbers are no way near as small as your extreme case. I do have the raw numbers (ie every credit and therefore the totals) and the changes are not that dramatic. It’s still thousands of credits per year.
Peter
June 22, 2018 @ 6:12 am
For such a comprehensive study of gender balance, it’s strange it does not tell me, simply, male/female industry ratios in TV year on year, outside of how it clusters around episodes.
Up to you of course, but as you seem to have access to this data, I’d suggest it would be worthwhile working towards releasing it.
(This is a response to your comment beginning “Yes and No”)
Happy to help where I can.
First off, here is the ratio of male to female writers credits from all of the ACLS data with broadcast dates between 2000 and 2016, inclusive:
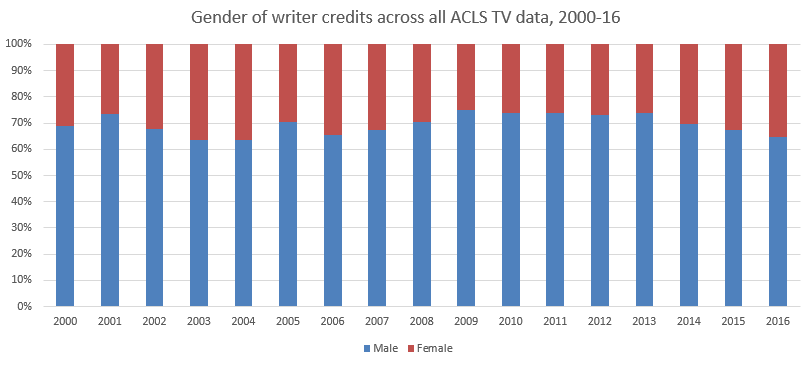
I’m not sure what use this is, as it combines together all manner of channels, shows and timeslots meaning that it’s too broad to be telling us anything.
In your request you said “outside of how it clusters around episodes”. What do you mean by that? The stats above look at the credits received, so if someone worked on five episodes in a year then they come up five times. Are you asking for the split on the number of people who have written at least one episode of any TV show in a given year? Just to be safe, here it is:
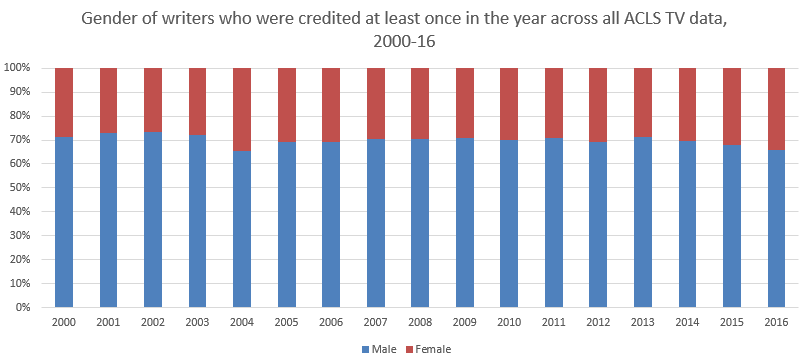
Let me know if this is what you were after.
Peter
June 22, 2018 @ 9:29 am
By clustered, I simply meant the metric that divided episodes into male and female dominated. My point was that an episode which is 100% female dominated and 51% female dominated would fall into the same bucket, so a rawer figure would actually be more useful.
However, it’s really good that you released these graphs as they give context to your 30% figure on pg 48. Many thanks.
Oh I see. Yup, that makes sense. In the vast majority of cases, there were only a few writers in a team. Therefore, the most frequent percentages were 100% (i.e. all male/female), 50% (a pair), 66% (team of three) and 75% (for team of four). You’re right that counting 66% the same as 100% is broad clustering. It’s always tricky to work out where to draw the line when studying film and TV. It’s the age-old coastline problem, but with many extra dimentions! I aim to find the least objectionable groupings (i.e. reducing selection bias) but at the same time keeping them useful and understandable.
Peter
June 22, 2018 @ 9:55 am
Peter
July 2, 2018 @ 9:46 am
It is generally understood that agents are key gatekeepers in the industry, which is somewhat confirmed by your own polling:
“Polling suggested clear patterns in how writers find work. The vast majority of writers, both male and female, are hired through pre-existing industry contacts, and through agents.” Pg 106
So I am surprised that you do not analyse the male/female ratio of literary agents who deal with screenplays and then the male/female ratio of their respective client lists?
Peter
July 9, 2018 @ 10:40 am
Do I understand the time periods for your table on pg 94 correctly:
Phase 1 – 2007-2014
Phase 2 – 2001-2016
Phase 3 – 2001-2016
Phase 4 – 2001-2016
No, it’s not that neat. This chart is illustrative of previous research in the report – nothing new. So each of the figures will relate to the dates as previously mention when that particular topic was discussed in detail. The vast majority of film stats are for 2005-16, most TV stats are for 2001-16, and film education stats are 2007-14.
Peter
July 18, 2018 @ 8:40 am
Thank you. However, it does a raise a concern. On this page (94), you say “the table above provides an outline of career progression” – the key word being “progression” – but surely you can’t be saying that the female demographic starts at 39% in phase 1 and – over time – ends in say 6% for Big Budget Features in phase 4 – because (as above) all 4 of these phases cover the same or a similar time frame?
Surely to understand progression between the phases, they would need to focus on consecutive time frames? Put another way, if the film stats for phase 4 related to 2005-2016, then the previous phases up to that stage in phase 4 would need to relate to time periods before 2005 in sequential, non-overlapping, time periods?
No worries. I see what you’re saying but I think it’s clear to readers what it shows and it’s purpose. It’s an illustrative summary of what they’re already read.
Peter
July 30, 2018 @ 8:38 am
Thanks for responding to my questions in the way you have. I wanted to summarise and wrap up my thoughts. I think there are significant flaws in your data and its presentation – I don’t think any conclusions can be considered reliable based on it and I have given some examples of my concerns on this page. But maybe I’m wrong? I wonder if you have considered submitting it to an academic peer review process or to something like StatCheck.
I think it’s interesting that the response to your survey was so low. There’s also very little social media engagement on the Equality Writes hashtag from writers, so I wonder if the membership doesn’t feel that this is quite the hot button topic the Writers Guild Leadership feels it is.
No problem. I really appreciate the time and consideration you’ve given to talking about the report and our conclusions. The topic needs far more intelligent debate than it generally gets.